Input For Classification
The ccAFv2 classifier requires a thoroughly quality-controlled Seurat object. SCTransform is preferred, standard normalization only applies to the highly variable genes. This can exclude genes needed for the accurate classification of the cell cycle. The PredictCellCycle function re-runs SCTransform to retain all genes in the dataset.
An example QC pipeline used on the U5 human neural stem cell (hNSC) dataset is available here.
Neuroepithelial Input Data
The U5 human neural stem cell (hNSC) dataset used to train the ccAFv2 is available for testing purposes here. This data has been QC’d and normalized using SCTransform following our best practices described above.
Load packages
library(ccAFv2)
library(Seurat)
library(reticulate)
library(tensorflow)
Load in sample data
seurat_obj = readRDS('U5_normalized_ensembl.rds')
Marker Genes
Examining marker genes is crucial for accuracy. Predictions significantly worsen if fewer than 689 marker genes (80%) are present. Setting do_sctransform = TRUE maximizes marker gene overlap. Timing and 93/93 values may vary by dataset, which is normal.
seurat_obj = PredictCellCycle(seurat_obj,
                 threshold=0.5,
                 include_g0 = TRUE,
                 do_sctransform=TRUE,
                 assay='SCT',
                 species='human',
                 gene_id='ensembl',
                 spatial = FALSE)
Standard output:
Running ccAFv2:
  Redoing SCTransform to ensure maximum overlap with classifier genes...
  Total possible marker genes for this classifier: 861
    Marker genes present in this dataset: 861
    Missing marker genes in this dataset: 0
  Predicting cell cycle state probabilities...
93/93 [==============================] - 1s 4ms/step
  Choosing cell cycle state...
  Adding probabilities and predictions to metadata
Done
Cell Cycle Classification Results
The results of the cell cycle classification are stored in the Seurat object metadata. The likelihoods for each cell cycle state can be found with the labels of each cell cycle state ( ‘Neural.G0’, ‘G1’, ‘Late.G1’, ‘S’, ‘S.G2’, ‘G2.M’, and ‘M.Early.G1’) and the classification for each cell can be found in ‘ccAFv2’.
Note that when ‘include_g0 = FALSE’ there will still be a calculated likelihood for ‘Neural.G0’, however none of the predictions in the ‘ccAFv2’ column will be ‘G0’.
#check to ensure 'ccAFv2' colum exists
colnames(seurat_obj@meta.data)
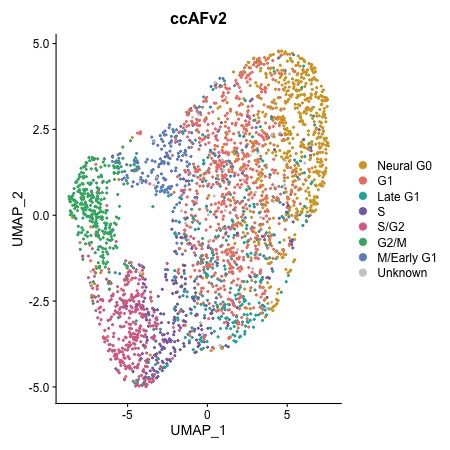
Plotting Cell Cycle States
Plot a UMAP with cell cycle states
DimPlot.ccAFv2(seurat_obj)
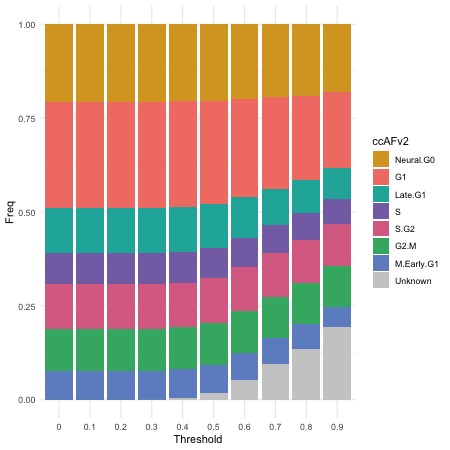
Impact of Varying Likelihood Thresholds
Cell cycle state likelihoods must meet or exceed the threshold; otherwise, cells are classified as “Unknown.” The removal of less certain classifications improves the accuracy of the overall classifications. For this dataset a likelihood threshold of ≥ 0.5 because it signifies a minimum of 50% certainty in the classified cell cycle state and >90% of cells could be assigned a cell cycle state. Users can adjust the threshold to suit specific datasets.
ThresholdPlot(seurat_obj)