Input For Classification
The ccAFv2 classifier requires a thoroughly quality-controlled Seurat object, with an example QC pipeline available here. SCTransform is preferred, standard normalization only applies to the highly variable genes. This can exclude genes needed for the accurate classification of the cell cycle. To address this, the PredictCellCycle function re-runs SCTransform to retain all genes in the dataset
Test Spatial Data
A slice of a human fetus 4 weeks post conception from Zeng et al., 2023 is available for testing purposes here. This data has been QC’d and normalized using SCTransform, following our best practices described above.
Cell Cycle Classification
library(ccAFv2)
library(Seurat)
spatial_obj = readRDS('GSM6736780_Spatial_10x_PCW4_20220122_slice1.rds')
spatial_obj = PredictCellCycle(spatial_obj, species='human', gene_id='symbol', spatial=TRUE)
Plotting Cell Cycle States Onto Images
To represent spatial RNA-seq data, cell cycle states are often mapped onto tissue slice images taken before sequencing. We use an enhanced SpatialDimPlot function that colors cells by their cell cycle state. This function supports all SpatialDimPlot parameters except group.by and cols.
library(ggplot2)
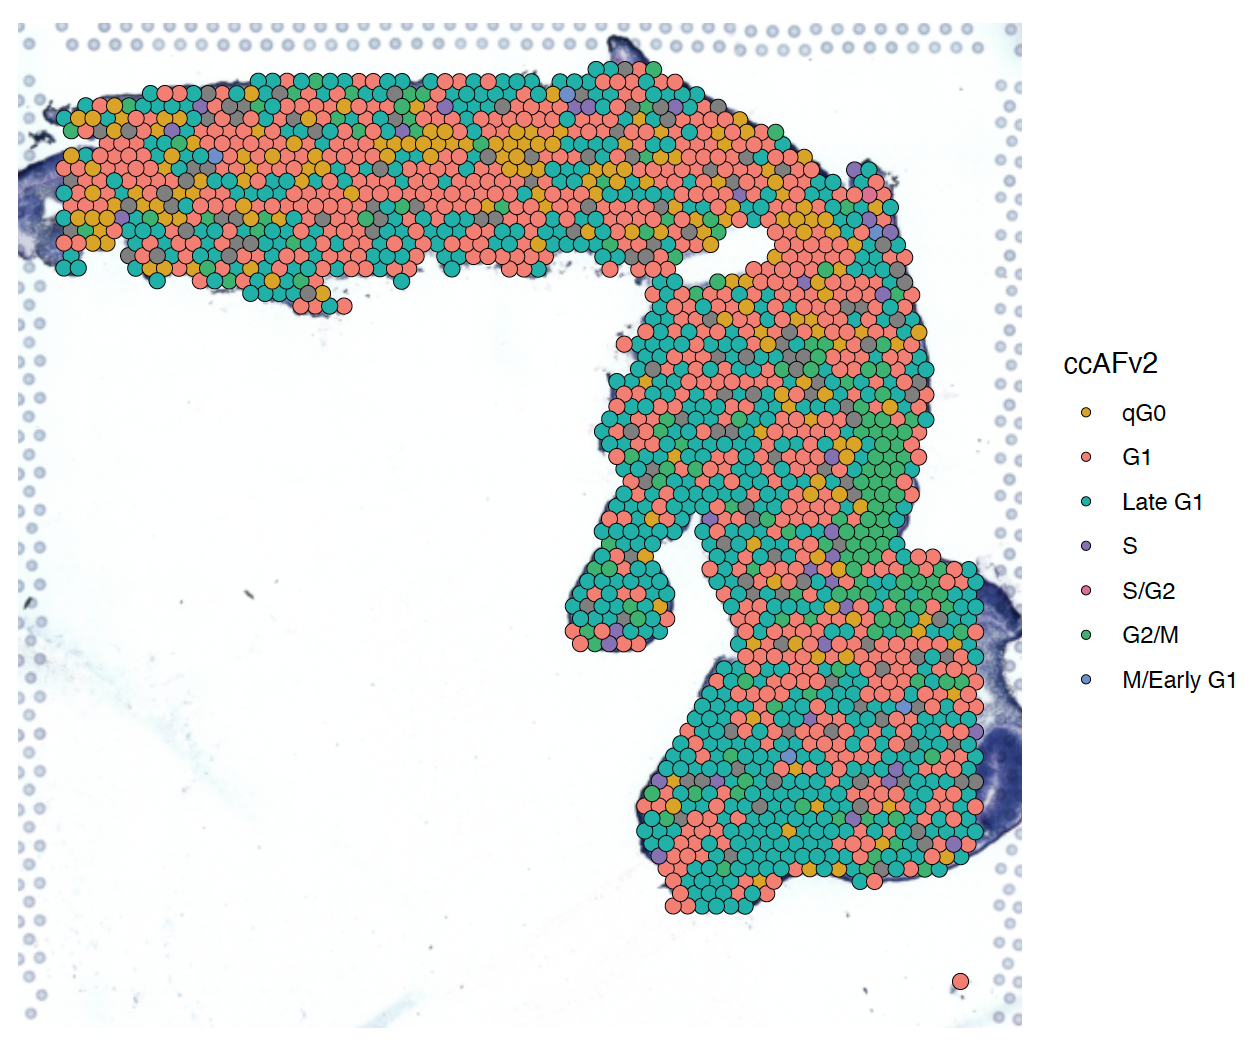
SpatialDimPlot.ccAFv2(spatial_obj) + theme(legend.position = "right")
SpatialDimPlot for slice 1 of a human fetus at 4 weeks post-conception colorized using the cell cycle states.
References
Zeng B, Liu Z, Lu Y, Zhong S, Qin S, Huang L, Zeng Y, Li Z, Dong H, Shi Y, et al. 2023. The single-cell and spatial transcriptional landscape of human gastrulation and early brain development. Cell Stem Cell 30: 851–866.e7. PubMed